Morning Star Candlestick Pattern: Meaning & How to Trade
Among the most trusted types of candlestick patterns in the stock market trading, the morning star candlestick pattern is one of the most accurate ones that indicates a bullish reversal. This is a strong indicator used by traders and investors to identify possible bottom formations following a consistent downward trend to ensure that they commit trades in advance of a new upward trend.
In this step-by-step tutorial, we will discuss what the candlestick pattern of morning star is, how to be able to recognize it, what it means, actual chart examples (along with morning star pattern Chartink scan) and how it is the opposite of its bearish counterpart, the evening star.
What Is the Morning Star Candlestick Pattern?
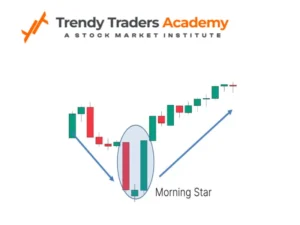
Morning star is a three-candles bullish reversal pattern that is formed at the terminus of a decline. It is an indication that the bears are fading over and the bulls are about to assume control.

Form of the Morning Star Pattern
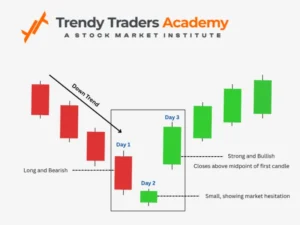
- First Candle – Bearish Candle: A long red candle indicates a powerful selling side and the process of further developing the current downward trend.
- Second Candle – Indecision or Doji: There is the emergence of a small-bodied candle (red/green) indicating a hesitation on the market. It is a state of indecision in which neither the buyers nor the sellers have superiority.
- Third Candle – Bullish Candle: An extended green candle which closes above the midpoint of the initial candle. This goes to confirm the fact that buyers have recovered momentum and hence could mean that there is a reversal in the trend.
To use a simple language, the pattern of the morning star signifies the transition of the market in a state of pessimism to optimism, just as the dawn breaks after a prolonged night.
Market Psychology of Morning Star
- The initial candle indicates that the sellers are still in control.
- The second candle is one of indecision – the market is taking a time tore-evaluate.
- The third candle proves the entry of the buyers who have driven the prices up.
- This shift captures the emotional movement of the market: fear into hope, then purchasing pressure.
How to Find the Morning Star Candle Pattern in 60 seconds?
- Find a Downward trend: The trend will have to come upon a definite downtrend.
- Spot the First Candle: Search a large red (bearish) candle that shows that they are selling.
- Find the Middle Candle: The second candle must be small with an indication of indecisiveness. A Doji is often ideal.
- Check the Third Candle: A giant green (bullish) candle that closes on top of the middle of the initial candle indicates a legitimate morning star formation.
- Check Volume: The trading volume is high during the third candle which reinforces the signal.
- All these requirements being satisfied, the candlestick pattern of morning star will affirm a probable bullish reversal.
Spotting with Morning Star Pattern Chartink
Traders have been using scanners such as Chartink to automatically identify trading setups. The morning star pattern Chartink filter enables the traders to filter stocks with this particular candlestick configuration.

To configure a pattern of morning star Chartink scan:
- Find three straight candles that satisfy the criteria of a morning star.
- Make sure that the third candle is closing higher than the middle of the first.
- The stronger signals can be added with volume and RSI filters.
- This automation will save you hours of manual chart analysis and will give you a higher probability of identifying high-probability trade setups.
Difference between Morning Star and Evening Star Pattern
Feature | Morning Star Pattern | Evening Star Pattern |
Type | Bullish Reversal | Bearish Reversal |
Appears After | Downtrend | Uptrend |
First Candle | Bearish | Bullish |
Second Candle | Indecision (small body) | Indecision (small body) |
Third Candle | Bullish (confirmation) | Bearish (confirmation) |
Example of a Morning Star Candle Pattern
To explain the candle pattern of the morning star in a simple example, we will use the following one: Consider a stock that is moving down from ₹500 to ₹450.
- Day 1: A big red candle is created, and the candle finishes at ₹445.
- Day 2: A small bodied candle (say 446 open and 448 close) is a sign of indecision.
- Day 3: A green candle with a strong close of ₹470- a price which is above the middle of the first candle.
- It is an ideal pattern of morning star candlestick and this means that the price might increase at any moment.
Morning Star Pattern Trading Strategy
- Entry Point: When the third candle closes above the midpoint of the first, then enter the trade. To validate this, wait until there is one more bullish candle.
- Stop Loss: You can set your stop loss a bit below the bottom of the second candle (the indecision candle).
- Profit Target: Take a 1:2 or greater ratio of risk and reward or use past areas of resistance.
- Confirmations: Add the morning star formation to other indicators including: RSI crossing above 40, MACD bullish crossover.
Escape out of short-term moving averages. As these signals coincide, the morning star candlestick formation gives a high-probability trade formation.
Benefits of Morning Star
- The bears dominate first.
- The market is then left in limbo.
- This lastly, by conviction, bulls regain their control.
This is a mere but mighty psychological development that provides traders with an evident visual reversal. The pattern of the morning star becomes a powerful indicator when it is used with the support levels and high volume.
Morning Star vs Morning Star Cathode Pattern
Other times the pattern is simply called the morning star or the morning star candle pattern by the traders. The two terms refer to the same thing, which is a three candles bullish reversal signal.
Nevertheless, the candle pattern of morning star highlights the candlestick pattern of particular interest whereas the word morning star can be combined with more general market analysis.
These concepts will make you read analysis articles, screeners such as morning star pattern Chartink, and instructional video content more correctly.
Combining Morning Star and Indicators
In a bid to enhance accuracy, the traders tend to use the candlestick pattern of morning star with technical indicators like:
- Relative Strength Index (RSI): Once the pattern is formed, RSI crosses above 4050 then it indicates that there is bullish momentum.
- Moving Averages (MA): Third-candle will add confirmation in case it closes above 20-day MA.
- Volume: The rising volume on the third candle is the confirmation that the institutions are buying.
- You can easily make the pattern of the morning star more than just a visual indicator by mixing price action and indicators into a full trading signal.
Risks of trading the Morning Star
- Although it is an effective one, the candlestick pattern of the morning star is not infallible.
- It can not perform in lateral or unstable markets.
- False signals do not have a volume confirmation.
- Should be accompanied by support/resistance analysis to be reliable.
- Risk management should always be used but by no means should you base your trading decisions on the morning star candle pattern.
Conclusion
One of the most reliable indicators in technical analysis that should be used to determine bullish reversals is the morning star candlestick pattern. It graphically represents the emotional transformation in the market – 3 selling pressure, 3 renewed buying strength. When used correctly, tools like the Morning Star pattern on Chartink, along with volume and RSI confirmation, can become powerful weapons for any trader.
FAQ'S
What is the morning star candlestick pattern?
It is an indication of a possible reversal of a downward trend which may be bullish.
What is the number of candles that constitute the morning star?
It has three candles that include bearish, indecision, and bullish.
Is the morning star pattern bullish or bearish?
It is a bullish trend which indicates the beginning of the upward trend.
Is it possible to apply the morning star in intraday trading?
Yes. It operates at every period of time intraday, daily, or weekly.
What is the morning star pattern Chartink?
It is a stock scanner application to determine the pattern in an automatic way.
What is the difference between morning star and evening star pattern?
Morning Star = Bullish reversal. Evening Star = Bearish reversal. Morning Star depicts fear evolving into optimism; Evening Star depicts optimism evolving into caution.


