
Bearish Candlestick Patterns: The Ultimate Guide to Spotting Market Reversals in 2025
Ever thought why the stock market takes a turn for the worse after a very big rally? Traders around the world depend on visual signals, but the most trusted ones are bearish candlestick patterns. Learning to identify these patterns is not just valuable- it’s vital for any individual hoping to sidestep sudden falls or even profit from dropping prices.
This blog will delve into bearish candlestick patterns, teach us the best ways to implement them and dive deep into signals that are powerful , such as the bearish engulfing candlestick pattern.
What Are Candlestick Patterns?
Before we get particular, we need to go through the basics. Candlestick patterns are a visual portrayal of the movements of price on a chart. Each candle represents the open, high, low, and close over a certain period (for example, a daily chart), giving traders indications about market psychology
- Bullish candlestick patterns can represent potential increase in price
- Bearish candlestick patterns suggest prices are likely to go downtrend or that there might be a reversal after an uptrend.
Traders watch these patterns because they’ve stood the test of time—they work in Indian, US, and global markets alike.
Why Master Bearish Candlestick Patterns?
Spotting bearish candlestick patterns early gives you:
- A chance to exit profits before a drop
- The option to take short positions or hedge existing holdings
- Insights into market psychology and the shifts from optimism to cautious approach
- Bearish signals are especially helpful in choppy or overbought markets where a price reversal could represent fast, sharp movements.
Key Bearish Candlestick Patterns Explained
Let’s look at the most popular and reliable signals. Each comes with its own “story” about how buyers and sellers are battling for control. Remember—context matters! Patterns at resistance zones or after big rallies are usually more powerful.
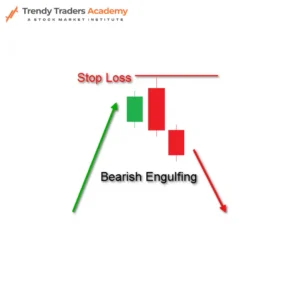
1. The bearish engulfing candlestick pattern
Definition:
A two-candle setup where a small green (bullish) candle is completely “engulfed” by a larger red (bearish) candle the next day.
Psychology:
On day one, bulls stay hopeful. The next session, a powerful wave of sellers takes over, overwhelming buyers completely.
Why It’s Powerful:
The bearish engulfing candlestick pattern marks strong reversals—especially after a steady uptrend.
Spotting the Pattern:
- Uptrend in play
- First candle: small and green
- Second candle: opens higher, closes far below first candle’s low, and is red
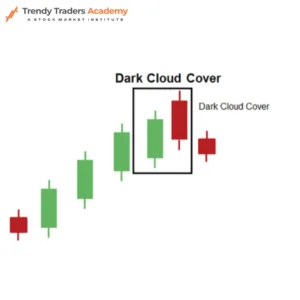
2. The Dark Cloud Cover
Definition:
Begins with a strong green candlestick, then a red candle that opens above the prior close and ends deep into the green candle’s body.
Trader’s View:
Bulls are caught off guard as sellers appear quickly, suggesting a sharp change in sentiment.
3. The Evening Star

Definition:
A three-candle formation:
- Strong green candle (buying pressure)
- Small-bodied candle, any color (market uncertainty)
- Large red candle (strong selling)
Reading It:
The shift from bullish strength to indecision, then to clear selling, marks a high-probability reversal—making this one of the most respected bearish reversal candlestick patterns.
4. The Shooting Star

Definition:
A three-candle formation:
- Strong green candle (buying pressure)
- Small-bodied candle, any color (market uncertainty)
- Large red candle (strong selling)
Reading It:
The shift from bullish strength to indecision, then to clear selling, marks a high-probability reversal—making this one of the most respected bearish reversal candlestick patterns.
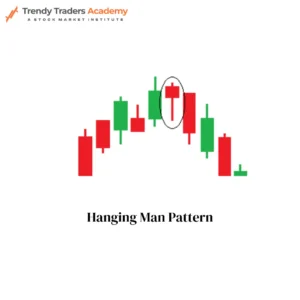
5. The Hanging Man
Definition:
A candlestick with a small body near the top, long lower shadow, and minimal upper wick, coming after a price rise.
Why Watch It:
Shows that sellers tried to grab control during the session—and may take over soon.
Table: Popular Bearish Candlestick Patterns At a Glance
Pattern Name | # of Candles | What to Look For | Level of Reliability |
Bearish Engulfing | 2 | Big red candle overtakes prior green | Very High |
Shooting Star | 1 | Long upper wick, small body (top of trend) | High |
Evening Star | 3 | Bullish, neutral, then bearish | High |
Dark Cloud Cover | 2 | Red opens above green, closes deep in body | Medium-High |
Hanging Man | 1 | Small body, long lower wick (after rally) | Medium |
How to Use Bearish Candlestick Patterns in Your Trading
- Always check the bigger picture. Patterns work best at the top of an uptrend or near resistance.
- Look for confirmation. Volume spikes, a gap down, or follow-up red candles boost confidence in a bearish turn.
- Set clear entry and stop-loss points. Entering right after confirmation (e.g., breaking below a pattern’s low) keeps risk in check.
Example:
If a bearish engulfing candlestick pattern forms on a major Indian stock after a week of gains, wait for the next day to see if price follows through downwards. Enter a short trade below the engulfing candle’s low, with a stop just above its high.
Real-Life Example: Bearish Reversal in Action
Imagine Reliance Industries rallies for three days. On day four, a slim green candle is totally swallowed by a big red candle. The bearish engulfing candlestick pattern appears. The next day, sellers add fuel: prices go down sharply, potentially confirming a reversal. A disciplined trader sells or shorts, protecting gain or even making new profit.
Bullet List: Common Mistakes When Using Bearish Candlestick Patterns
- Acting on one candle without bigger trend confirmation
- Ignoring patterns that form during sideways moves (less reliable)
- Trading without setting stop-losses
- Forgetting to check news or earnings dates before trading
Bearish Candlestick Patterns and Market Psychology
Each candlestick pattern is a story of buyers vs. sellers in real time. Bearish patterns often show bulls running out of steam and sellers gaining courage. When seen after sustained rallies, these patterns can foreshadow some of the market’s sharpest drops—don’t ignore them!
Table: How to Combine Candlestick Patterns With Indicators
Indicator | Confirmation for Bearish Patterns | How to Use With Patterns |
RSI | Overbought >70, then reversal | Bearish pattern at high RSI |
Volume | Spike on red candle | Adds strength to bearish signal |
Moving Average | Pattern forms near major MA | Reversal at or above 50/200 MA |
Trendlines | Pattern at resistance | Double confirmation of reversal |
Recap Table: Bearish Candlestick Patterns and What They Signal
Name | Key Visual Cue | Typical Setup | Trading Signal |
Bearish Engulfing | Big red, covers green | Uptrend to reversal | Strong sell cue |
Shooting Star | Long top shadow | Rally tops | Early sell warning |
Evening Star | Three-candle setup | End of upswings | Major reversal ahead |
Dark Cloud | Red opens above green | Sharp reversal | Profits to be booked |
Hanging Man | Long lower shadow | After steady gains | Caution, possible peak |
Conclusion:
Mastering bearish candlestick patterns is a game-changer for proactive traders. From the power of the bearish engulfing candlestick pattern to the nuance of evening stars and other bearish reversal candlestick patterns, these visual markers provide the earliest warnings of trouble ahead.
But remember: even with the best candlestick patterns, discipline wins. Always confirm signals, use prudent risk management, and let price action—not hope—guide your trades.
FAQ'S
Why are bearish engulfing candlestick patterns so reliable?
They show a complete shift from buying to selling in a single dramatic move, especially meaningful after strong uptrends.
Can I use bearish reversal candlestick patterns on intraday charts?
Absolutely! They can be implemented across all timeframes—daily, hourly, even 5-minute charts—but reliability increases along with higher timeframes.
Are all candlestick patterns equally reliable?
No; bearish engulfing, evening stars, and shooting stars are most widely tracked.
Should patterns be used alone?
One can combine technical indicators (like volume, RSI, or moving averages) with patrerns for the better results.


