Cup and Handle Pattern : Overview & Strategies
In the area of technical analysis, special figures should be used to determine certain probable price changes among traders. One more popular pattern is the Cup and Handle pattern which is considered as the bullish continuation pattern that indicates potential breakout of a price. For one, whether you are a beginner trader, or are looking to improve your charting skills, having an understanding of the Cup and Handle pattern is beneficial in preparing for movements in the market. As we move through this blog, we’ll cover the Cup and Handle formation, its psychological implication, trading tips, as well as its drawbacks.
What is the Cup and Handle Pattern ?
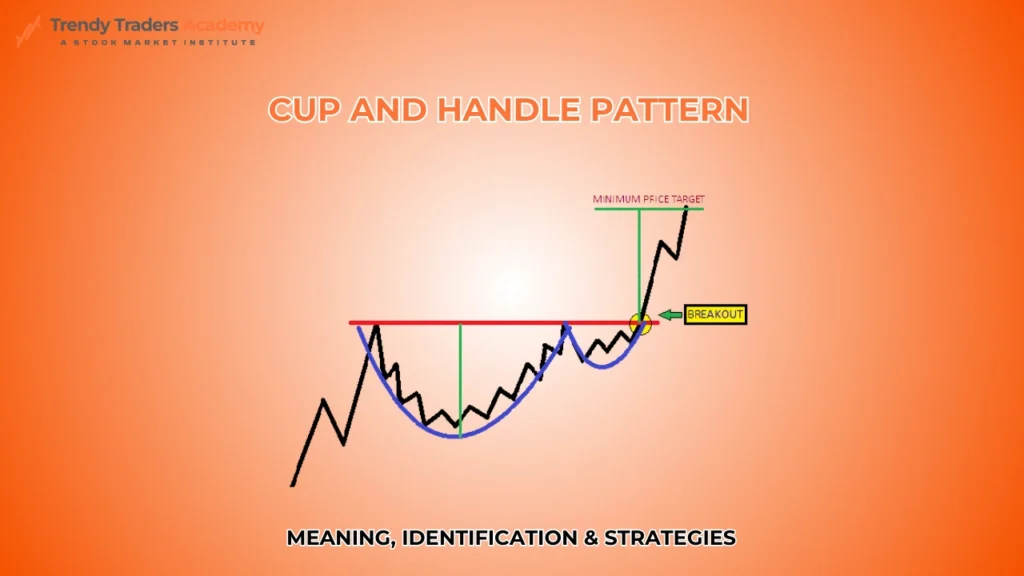
The Cup and Handle chart pattern is a continuation (bullish) formation that looks like a teacup. It consists of two primary components:
The Cup: This is a type of open bottom which appears to be a U-shape like a cup shaped base.
The Handle: After the cup, another consolidation phase appears a little tinier on the right side forming the handle of the cup.
It is usually formed during an advanced uptrend and, therefore, may be viewed as an indication that the price is likely to resume the uptrend after the pattern on the chart is finished.
Characteristics of the Cup and Handle pattern
1. Cup Formation
- The left side of the cup starts with the price drawdown which is often associated with profit taking or bearish sentiment.
- These lightened up spikes are suggestive of smoothed stability at the bottom of the cup and bearishness transforming into bullishness in the market.
- The right side of the cup occurs as the price moves up to again test the previous high point thus giving the cup its ‘U’ like shape.
2. Handle Formation
- The handle develops as a brief phase of accumulation or a marginal retreat after the construction of the cup.
- It is independent and local in subject matter, and it takes the form of a flag or pennant, inclined downward or horizontal and shifting sideways.
- It shows variable fluctuations before a start in the case of a stock that may go bullish some time in the future.
3. Breakout
After the handle is formed, one finds the price rising and breaking the resistance level, which was the formation of the handle.
Psychology of Cup and Handle Pattern
The Cup and Handle pattern reflects market psychology and the dynamics between buyers and sellers:
Formation of the Cup: The initial fall happens at the anticipation of the dominancy of the sellers, which tends to push the price down. However, as the price comes to down to a support level, there is a number of buyers that start buying the product and thus gradually driving up the price.
Formation of the Handle: For others, they can quickly exit selling their stocks taking profits after finding their way back to the resistance level, thus pulling back or consolidating. This creates the handle.
Breakout: The bullish pressure to force a break through the resistance level makes it possible to lure more traders into the market.
Identifying Cup and Handle Pattern
Accurately identifying the Cup and Handle pattern requires careful observation of the following factors:
- Timeframe
The pattern can develop on any time frame including intraday charting, daily charting or even weekly or monthly charting. However, as it will be seen, longer periods generally give better signals.
- Volume
Usually, volume declines during the formation of the cup and handle pattern. A sharp increase in volume supports the breakout, thus reinforcing the uptrend assertion.
- Depth of the Cup
The depth should in actual fact be of moderate extent. A small cup may be associated with a weak price pattern and deep cuping with high fluctuation.
- Handle Proportion
The handle of the cup should not be more than one-third of the height of the cup. It is actually possible that a deeper handle may in fact diminish the reliability of the pattern.
The Cup and Handle Pattern trade
To effectively trade the Cup and Handle pattern, follow these steps:
- Identify the Pattern
The curve should be U shaped followed by a handle. See to it that the handle is of comparatively small size and as far as possible of less volume than the cup itself.
- Wait for a Breakout
The breakout is initiated when the price bar closes above the resistance level which is at the rim of the cup. This is a confirmation signal of great importance.
- Set Entry Points
Buy the security when the price moves above the resistance level with high turnover. This re-affirms the fact that there are over -averaged positive buying signals.
- Set Stop-Loss Orders
It is wise to get the stop loss below the lowest mark of the handle to minimize the risk.
- Set Profit Targets
Take the dimension of the cup and extend this measurement along the vertical line from the breakout point to reach the profit target.
- Monitor Volume
Make sure this breakout is real with a spike in trading volume. This can be attributed to the low volume magnitude during the breakout to indicate false breakout.
Cup and Handle Pattern target
The Cup and Handle pattern target refers to the price projection calculated after a breakout from the handle. Here’s the exact formula for the target:
Target Price = Resistance Level + (Resistance Level – Cup Bottom)
Explanation:
- Resistance Level: The highest point of the cup before the handle starts.
- Cup Bottom: The lowest point of the cup.
Breakout: The point where the price breaks above the resistance level of the handle
Types of the Cup and Handle Pattern
While the classic Cup and Handle pattern is bullish, variations exist:
- Inverted Cup and Handle Pattern
Inverted Cup and handle pattern is also known as reverse cup and handle pattern where bearish formation is the very opposite of the Cup and Handle formation on the chart. It appears during a downtrend and the signal is generally a continuation of the down trend.
- Rounded Bottom
Occasionally the cup is formed and following this a rounded bottom pattern is used instead of a handle. However, a reversal such as this doesn’t have the handle, but if it is positioned in a way that is similar to this, it can show bullish indications.
Advantages of Cup and Handle Pattern
Reliable Indicator: Once diagnosed it is hard for the pattern not to have a high success rate.
Clear Entry and Exit Points: It includes clearly defined breakout levels as well as profit settings.
Adaptability: It can be used with different types of assets, stocks, forex, and cryptos among them.
Volume Confirmation: Its reliability increases with the growing volume during the breakout.
Limitations of Cup and Handle pattern
Subjectivity: Interpreting the pattern is also somewhat ambiguous, because not every cup or handle looks like a cup and handle.
False Breakouts: The problem with breakouts is that they may not work if they are not supported by sufficient volumes.
Time Consuming: The pattern can even take weeks or even months to form and this might not be ideal for short-term traders.
Limited in Downtrends: That is mostly useful in uptrends and may not even give out good signals in a bear market.
Guidelines of how to trade the cup and handle pattern
Use Other Indicators: Use the pattern with another technical indicator like the moving averages or the RSI to affirm.
Avoid Overly Deep Cups: This may be true, but excessive volatility may decrease the stability of the pattern .
Be Patient: Do not enter into a trade until after the breakout confirmation signal has occurred.
Stay Disciplined: Remember to always use the stop-losses and the profitable target levels’ so as to manage risk well.
Conclusion
The Cup and Handle formation is one of the more effective technical tools available to us, the technical analysts and traders. Due to the fact it connotes bullish progression in uptrend it is one of the most useful indicators when identifying good trading opportunities. However, like most technical indicators, it should be used as just one of many tools and the trader should abide by his/ her rules.
Cup and Handle patterns may be the easiest of the patterns, but to get the best results, you need to learn the tricks of such patterns to increase your chances of trading in the right manner. This pattern translates to the stock market, forex or trading in other cryptocurrencies, and remains one of the most important pattern-recognition techniques to chart analysis, and can guide traders to possible breakouts.
Also Read : What is Index in Stock Market
FAQ'S
What is a cup and handle pattern ?
The cup and handle pattern is a bullish continuation pattern in technical analysis. It resembles a “U” shape (the cup) followed by a slight downward drift (the handle), indicating potential upward price movement after the breakout.
What is the inverted cup and handle pattern ?
The inverted cup and handle pattern is a bearish reversal pattern. It resembles an upside-down “U” (the inverted cup) followed by a small upward retracement (the handle), suggesting a potential downward price movement.
What is the reverse cup and handle pattern ?
The reverse cup and handle pattern is another term for the inverted cup and handle. It signals bearish sentiment and a likely drop in the asset’s price after the breakout.
How do I identify a cup and handle pattern ?
Look for :
A “U”-shaped consolidation (the cup)
A slight downward price correction forming the handle
A breakout above the handle’s resistance level for confirmation
What is a cup and handle pattern target ?
The Cup and Handle pattern target refers to the price projection calculated after a breakout from the handle. Here’s the exact formula for the target:
Target Price = Resistance Level + (Resistance Level – Cup Bottom)
How do I trade the inverted cup and handle pattern ?
For the inverted cup and handle:
- Look for a price breakdown below the handle’s support level.
- Set a target by measuring the depth of the inverted cup and subtracting it from the breakout point.
Can the cup and handle pattern fail ?
Yes, like all technical patterns, it can fail due to:
- Insufficient volume during the breakout
- Unfavorable market conditions
- False breakouts above or below the handle


