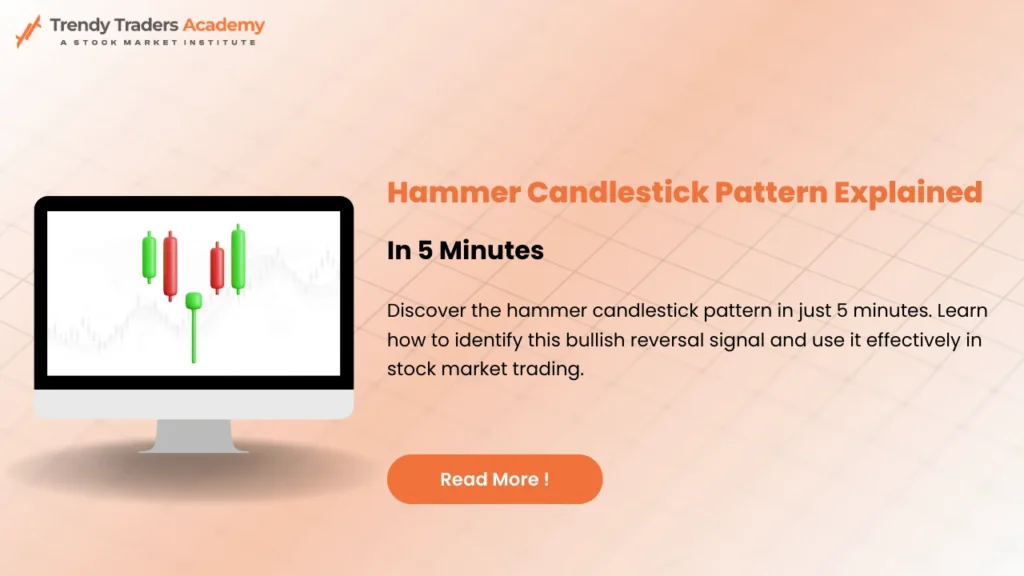
Hammer Candlestick Pattern Explained in 5 Minutes
If you’ve ever stared at a price chart and wished for a clear sign that the market might be about to reverse, look no further than the hammer candlestick pattern. This simple yet powerful formation is a favorite among technical traders worldwide. Whether you’re an aspiring investor, seasoned swing trader, or day trader just getting started, learning to spot the hammer—and its close relatives like the inverted hammer candlestick pattern and double hammer candlestick pattern—can help you enter trades with more confidence and less guesswork.
This fully original guide will not only demystify the hammer and its variants, but also show you how to combine these candlestick patterns with smart trading strategies for higher accuracy and better results in 2025.
What is the Hammer Candlestick Pattern?
The hammer candlestick pattern is a one-candle reversal signal that typically forms after a price decline—alerting traders that selling pressure may be coming to an end and buyers are stepping in.
Key visual characteristics:
- Small real body (the box area between open and close)
- Long lower wick (tail) that’s at least twice the body’s length
- Little or no upper wick
This distinctive “T” shape looks like a hammer—and just like its namesake tool, it often signals that a bounce or “bottoming out” is underway.
Psychology Behind the Hammer: Sellers drove prices sharply lower after the open, but by the end of the session, buyers had pushed prices most of the way back up—showing strong demand and the possibility of a trend reversal.
Reading and Recognizing Hammer Candlestick Patterns
How do you spot a true hammer?
- The stock is in a downtrend or recent decline.
- A small green or red body sits at the session’s top.
- There’s a pronounced lower shadow (at least 2x the body).
- The upper shadow is absent or very short.
The hammer candlestick pattern is best used after a strong downward phase—at support levels, it signals a potential “floor.”
The Inverted Hammer Candlestick Pattern
What if the “hammer” forms upside down? That’s the inverted hammer candlestick pattern—another potential signal for reversal, but with a slightly varied twist.
Visual Features:
- Small real body at the bottom
- Long upper shadow (at least 2x the body)
- Little or no lower wick
Market Story:
After a period of selling, bulls attempt to rise the prices higher (making the long upper wick) but close just above the open. This pattern depicts that buyers are challenging the downtrend, but they require a confirmation candle (often another bullish candlestick) for proper control.
Where to Use:
Commonly visible after strong selling, at or near support, and sometimes ahead of news events.
The Double Hammer Candlestick Pattern: What Does it Mean?
Pattern hunters often spot two hammer-like candles in quick succession—this is the double hammer candlestick pattern.
Definition:
Two consecutive hammer or inverted hammer candlestick patterns—either matching or alternating—appear after a decline.
Significance:
Back-to-back hammers depicts fierce buyer resistance to drop the prices, amplifying reversal potential. If the second candle confirms with a higher close or comes with heavier volume, the odds of an potential upward move is in their favour.
Comparing Hammer Family Candlestick Patterns
Pattern Name | Visual Key | Typical Location | Buyer Strength Shown | Action Signal |
Hammer | Small top, long lower wick | End of downtrend | Buyers overcame sellers | Buy above high of hammer |
Inverted Hammer | Small base, long upper wick | End of downtrend | Buyer push, needs confirm | Buy after next up candle |
Double Hammer | Two hammers in two bars | After aggressive sell-off | Major buy defense | Strong reversal cue |
Practical Example: Trading with the Hammer Candlestick Pattern
Imagine SBI shares drop steadily for a week. On Friday, a hammer forms at ₹570 support—the long lower tail kisses ₹555, but buyers recover, pushing the price to close near ₹572. The next session, SBI opens higher and moves up further.
Entry & Stop-Loss:
- Buy above the hammer’s high (₹573)
- Stop-loss just below the low of the hammer (₹554)
- First target might be recent swing highs, say ₹590
This approach, used with strict risk-management, can offer high reward-to-risk setups based on candlestick patterns alone.
Combining Hammer Candlestick Patterns with Indicators
For stronger signals, blend patterns with technical tools:
- Moving-Average Support: Hammer forms near the 50/200 DMA.
- RSI/Oversold: Hammer at low RSI often means exhaustion selling.
- Volume Spikes: Look for heavier trading volume as confirmation.
- Trendlines: Pattern at a trendline bounce means higher odds trade.
Bullet List: Mistakes Beginners Make with the Hammer Candlestick Pattern
- Trading every hammer without checking overall trend or support.
- Ignoring confirmation candles—especially with inverted hammers.
- Forgetting stop-loss placement below the hammer’s low.
- Misreading long lower wicks in choppy, sideways markets.
Second Practical Table: Hammer Patterns vs. Other Reversal Signals
Pattern Type | Signal Produced | Best Used In | Entry Rule | Failure Risk |
Hammer | Short-term reversal | Downtrends, support | Wait for price above high | False signals in chop |
Inverted Hammer | Potential reversal | Downtrends, support | Confirm next up candle | Weak buy follow-through |
Double Hammer | Major reversal clue | After severe selling | Buy above second candle | News-driven markets |
Bullish Engulfing | Strong reversal | After long declines | Buy above engulfing high | Low volume = less power |
Advanced Tips: The Hammer Candlestick Pattern in Trending Markets
- In uptrends: Sometimes a “hanging man” is mistaken for a hammer—context matters! Hammer signals strength only when appearing after a fall.
- In sideways markets: Combine with breakout or breakdown candlestick patterns for best results.
- With moving averages: Hammers near widely watched averages often kickstart big bounces.
PDF & Resources: Learn with Hammer Candlestick Pattern Visuals
To deepen your learning, build your personal cheat sheet. Download a hammer candlestick pattern PDF or create annotated screenshots of real chart examples.
Mark:
- Pattern location (trend end, support)
- Volumes
- Resulting price action
- Entry & stop levels
Thanks to technology, dozens of resources and chartbooks let you practice “reading” hammers across all market phases.
Short Real-Life Story: The Double Hammer Bonanza
Arun, a Bengaluru-based trader, spotted two consecutive hammers on HDFC Bank after rapid declines to ₹1,320. Both hammers had heavy volume and formed just as RSI dipped below 30. The next day, HDFC Bank surged 3%. Arun’s patient reading of the double hammer candlestick pattern gave him a textbook low-risk/high-reward trade.
How Hammers Stack Up Against Other Candlestick Patterns
Pattern | Candles | Best For | Risk-Reward | Confirmation Needed? |
Hammer | 1 | Short-term reversals | High | Yes, for best results |
Inverted Hammer | 1 | Pre-reversal signal | Moderate | Always |
Double Hammer | 2 | Most powerful at bottoms | Highest | Yes |
Engulfing (Bullish/Bearish) | 2 | Major trend turns | High | Preferable |
Morning/Evening Star | 3 | Trend exits | Very High | Yes |
Sample Checklist for Using Hammer-Based Candlestick Patterns
- Is the market trending down?
- Hammer/inverted hammer formed at key support?
- Is entry above the pattern’s high confirmed by volume?
- Stop-loss tightly managed below the hammer’s low?
- Are you patient enough to wait for confirmation?
Conclusion
Getting a complete grasp on hammer candlestick along with other related candles such as inverted hammer candlestick pattern and double hammer candlestick pattern, gives one a visual shortcut to detect market reversal points- no complex math is needed!
One must use these candlesticks with context, follow them up with additional confirmation and always have good risk management. Over time, this will help one remove random chart noise from proper low-risk entry- smoothing one’s trading journey and building one’s confidence, candle by candle.
Also Download : Trendy Traders Academy’s Free Candlestick Patterns PDF.
Check more Candlestick Patterns
Bullish, bearish, neutral, continuation, and reversal patterns help traders identify market direction, momentum, and possible trend changes. | |
Inverted Hammer Candlestick Pattern | Signals a possible bullish reversal after a downtrend as buyers reject lower prices. |
Indicates potential bullish reversal where buying pressure appears after a decline. | |
Patterns that indicate buying strength and possible upward trend reversal or continuation. | |
Patterns that signal selling pressure and a potential downward trend reversal. | |
Confirms a strong bullish trend with three consecutive long bullish candles. | |
Warns of a possible bearish reversal after an uptrend due to selling pressure. | |
A bullish reversal pattern where buyers regain control after a strong bearish move. | |
Shooting Star Candlestick Pattern | Indicates bearish reversal when price rejects higher levels after an uptrend. |
Signals a bullish reversal using a three-candle structure after a downtrend. | |
Indicates a bearish reversal at the top using a three-candle formation. | |
A bearish reversal pattern where sellers enter strongly after a bullish move. | |
Three Black Crows Pattern | Confirms strong bearish momentum with three long consecutive bearish candles. |
Doji Candlestick Pattern | Shows market indecision where buyers and sellers are equally balanced. |
Marubozu Candlestick Pattern | Represents strong momentum with no price rejection, indicating trend continuation. |
Reflects uncertainty and loss of momentum in the current trend. | |
A smoothed candlestick method that reduces market noise and helps traders clearly identify trends. |
FAQ'S
Is a green hammer better than a red hammer candlestick pattern?
Both work, but a green hammer (close > open) shows slightly more buyer strength. Always check for confirmation in any case.
How reliable is the inverted hammer candlestick pattern?
Moderately reliable—works best if the next session brings a strong up move. Wait for confirmation before acting.
Does the double hammer candlestick pattern guarantee a reversal?
No candlestick predicts 100%. But double hammers mean increased buyer determination and raise odds for a short-term bounce.
Can these candlestick patterns be used on all timeframes?
Yes! From daily and weekly charts (for position or swing trades) to 5-minute charts (for intraday), but higher timeframes offer more reliable signals.
What Role Do Candlestick Patterns Play in Trading ?
Candlestick patterns provide visual cues about market sentiment and potential reversals or continuations. They are widely used in technical analysis for making trading decisions.


