
Top 5 Strong Bullish Candlestick Patterns | Trading Guide
Looking at price charts and hoping for a reliable clue that “buyers are back”? You’re not alone. For decades, market pros have relied on strong bullish candlestick patterns as early warning signs that tides may be shifting from sellers to buyers. If you find candlestick charts overwhelming, don’t worry—learning a handful of these bullish candlestick patterns can turn that confusion into trading confidence.
In this hands-on guide, you’ll discover the nuances of bullish signals—what works best, how to spot a bullish engulfing candle, and how you can use bullish candlestick pattern PDF resources, tables, and checklists in your daily routine. Let’s make your chart analysis smarter than ever this year.
What Is a Bullish Candlestick Pattern?
A bullish candlestick is nothing but a price bar where the closing price is greater than the opening price- green on all the charts. But when bulls (buyers) give out a powerful message, certain combinations of candles- known as bullish candlestick patterns- signal that an upturn might be possible going ahead in the market.
Why Do They Matter?
- Help spot trend reversals after big drops
- Identify high-probability buy zones
- Work across stocks, forex, commodities, and even crypto
- Are easily taught, visual, and don’t require advanced math
The Psychology Behind Strong Bullish Candlestick Patterns
Every candlestick represents a mini battle between buyers and sellers. The strongest bullish patterns depicts buyers gaining dominance—overcoming seller pressure, changing the mood of the markets, and flipping sentiment. These setups are so powerful that even institutional traders and AI-based strategies (yes, the stuff inside your favorite trading bots) rely on patterns like the bullish engulfing candle for generating signals.
Top 5 Strong Bullish Candlestick Patterns (With Unique Explanations)
Here’s your, original, no-fluff breakdown:
1. The Hammer
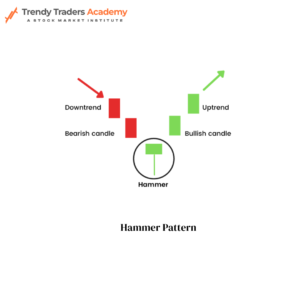
How to Spot:
The “hammer” looks like—you guessed it—a tiny green (or even red) body at the top, with a long lower shadow at least twice as big as the body.
Psychology:
Bears tried to push prices down, but by the session close, bulls stormed in to recover ground. This is often an early “bottom” sign.
2. Bullish Engulfing Pattern
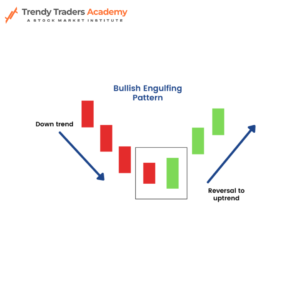
How to Visualize:
Day one: Stock closes lower (red candle). Day two: The green candle completely covers (or “engulfs”) the entire red candle from the day before.
Why It Works:
Sellers are overpowered as demand erupts. This sudden shift is marked, signaling a possible sharp bounce.
Where is it best?
After several red candles or at a significant support level.
3. Morning Star
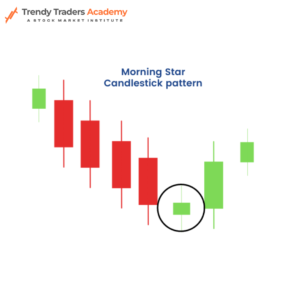
How to Remember:
Picture the night (big red candle), sunrise (tiny, uncertain candle), then the day (long green candle).
Trading Insight:
This trio captures exhaustion selling, then a moment of indecision, before the buyers launch a major push upwards.
4. Piercing Pattern
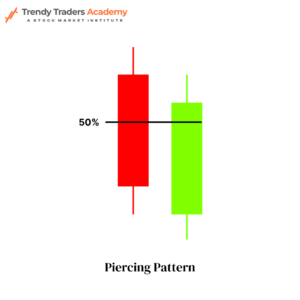
Quick Definition:
Starts with a strong down day, followed by a bullish candle that opens below the first but closes well above halfway into the first candle’s body.
Why Watch It:
It’s like bulls putting their foot in the door to halt further price drops.
5. Three White Soldiers
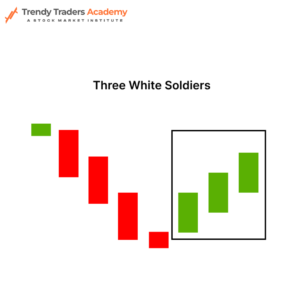
The Visual:
Three large green candles in a row, each closing higher than the one before and opening within the previous body (no big upper shadows).
Why It Screams Strength:
Shows organized, relentless buying—often the start of a fresh bullish move.
Master Table: Bullish Candlestick Patterns at a Glance
Pattern Name | Candles | Distinctive Features | Interpretation | Reliability |
Bullish Engulfing Candle | 2 | Green fully covers preceding red | Buyers overpower sellers | Very High |
Hammer | 1 | Long lower wick, small body at top | Bear trap, bullish reversal | High |
Morning Star | 3 | Down, pause, strong up candle | Market bottom forming | Very High |
Piercing Line | 2 | Second opens lower, closes above mid | Aggressive bull comeback | High |
Three White Soldiers | 3 | Three big green bars, rising closes | Persistent demand | Very High |
How to Use Strong Bullish Candlestick Patterns in Real Life
- Context is everything: Patterns perform best after a downturn or at support.
- Confirmation is key: Look for increased volume on the bullish candle—when big funds buy, volume swells.
- Risk management matters: Enter above the pattern’s high, place stop-loss below the low, and exit ahead of resistance.
Example: Bullish Engulfing Candle in Action
Imagine Tata Motors is in a 5-day downtrend. On day six, after more selling, the stock opens lower but reverses strongly to close above the previous candle’s open. Volume is above average. For a smart trader, this bullish engulfing candle combined with extra buyers is a high-probability buy signal.
Sample: Using Multiple Patterns With Support and Resistance
Market Scenario | Pattern to Watch | Action Plan |
Near key support zone | Hammer, Engulfing | Buy above pattern high after confirm |
End of long correction | Morning Star | Enter on confirmation day with stop |
Flat, low volume days | Wait for Three Soldiers | Enter above third candle, set tight stop |
Ways to Practice: PDF Resources, Journals & More
For deep study:
- Use a “bullish candlestick pattern pdf” downloaded from a trusted academy or brokerage. Print, annotate, and review these charts.
- Maintain a “pattern diary” — every time you see and act on a bullish candlestick, log it with date, price, and results.
- Backtest historical charts to build pattern-spotting confidence.
Pro Tips for Successful Use
- Never ignore volume: Large volume when a bullish candlestick forms means more conviction behind the move.
- Respecting resistance zones: Even strong bullish patterns can fail near major resistance levels.
- Combining with indicators: Support one’s trade plan with RSI, moving averages, or MACD for confirmation.
- Be patient with entries: Wait for a price to move above the high of the bullish pattern before entering.
- Set stop-losses below the low: Protects you from pattern failure.
Table: Comparing Bullish Patterns vs. Bearish Reversals
Signal Type | Example Pattern | Indication | Usual Action |
Bullish | Bullish Engulfing | End of downtrend | Buy on confirmation |
Bullish | Three White Soldiers | Sustained uptrend | Buy above third candle |
Bearish | Bearish Engulfing | End of uptrend | Sell or protect positions |
Bearish | Shooting Star | Trend top, possible drop | Prepare to exit |
Real-World Example: Combining Patterns and News
Suppose Infosys shares fall sharply after weak global cues. On the technical chart, a hammer forms at a long-term support level. The next day, a bullish engulfing candle appears alongside news of new large orders from Europe. Savvy investors identify double signals, check volume, and ride a rebound as sentiment changes.
Common Mistakes—and How to Avoid Them
- Mistaking patterns in choppy, low-volume markets (always confirm trend context)
- Skipping stop-losses—no pattern is fail-proof
- Entering before the pattern completes (wait for confirmation close)
- Using outdated or generic bullish candlestick pattern PDFs—seek resources filled with Indian market examples
Quick-Access Checklist: Spotting Strong Bullish Candlestick Patterns
- Is the market in a bearish phase?
- Did a bullish reversal candle form at a major support or after oversold readings?
- Does volume confirm the buying?
- Are there confirming news or other technical signals?
- Did the price cross above the bullish pattern’s high? (If yes, consider entry)
Also Read : Best indicators in trading
Conclusion
Strong bullish candlestick patterns are a trader’s secret arsenal for finding out when sellers are losing power and buyers are planning to gain control again. Whether its a huge bullish engulfing candle or a triumphant three white soldiers, these shapes are proper roadmaps even in times of unpredictable, choppy markets.
If one is new, they should start slow- have a bullish candlestick pattern PDF in hand, log live examples and always implement risk controls. Soon, observing bullish candlestick patterns will feel natural like checking the news – aiding one get a upper hand for winning trades, one green candle at a time.
FAQ'S
Are bullish candlestick patterns stronger on daily or weekly charts?
Patterns on higher (e.g., weekly) timeframes generally give better reliable signals than on short intervals, which can be noisy.
Can I use only one bullish candlestick pattern and attain profits?
Relying on just one is limiting. Combine several strong patterns (bullish engulfing candle, hammer, morning star) gives better accuracy for long term.
Where’s the best place to find a bullish candlestick pattern pdf with real charts?
Major brokers, exchange learning portals, and advanced trading websites offer such downloadable references—look for ones with chart annotations and explanations.
What are Bullish Candlestick Reversal Patterns ?
The bullish candlestick reversal patterns indicate a status of a shift from bearish/Down trend to bullish/Up trend . Reversal patterns can be classified as Bullish Engulfing pattern, Morning star pattern, Hammer and Piercing Line.
What is a Bullish Engulfing Candle ?
A Bullish Engulfing is a two candle pattern in which a small black/ red candle is overwhelmed by a large green/ white one. The second candle seems to ‘swallow’ the first one which is a bearish candle – it means that the market is probably reversing up.


