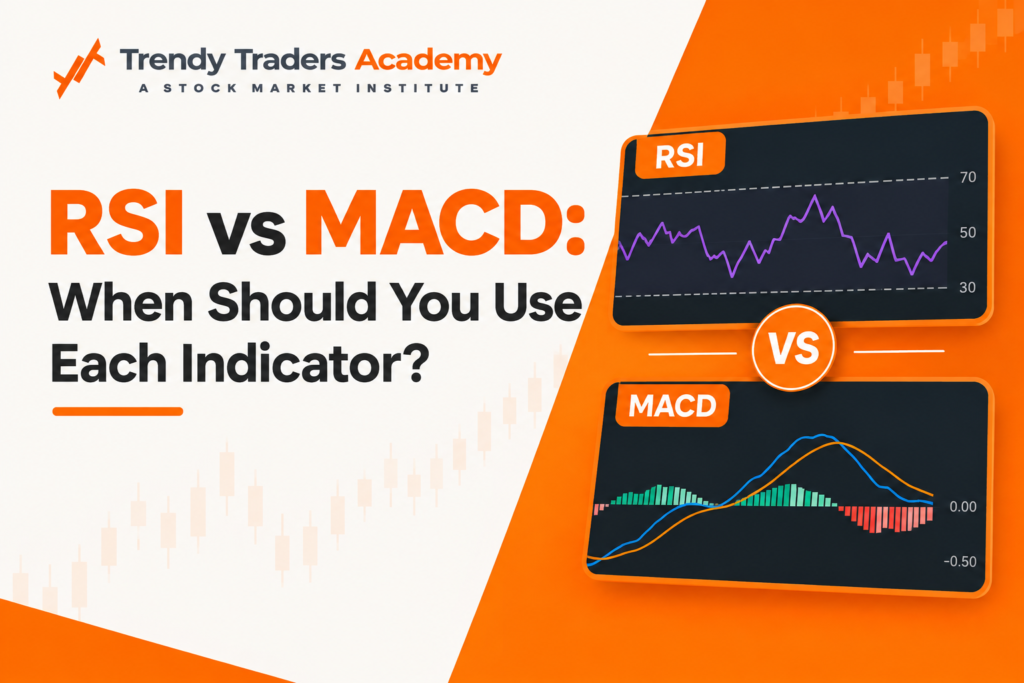
RSI vs MACD: When Should You Use Each Indicator?

Quick Answer
Use RSI when you need a quick read on momentum and possible exhaustion; When you want to learn about the direction of the trend and shifts, in momentum you should use MACD. Neither should replace price action. The better approach is to figure out the chart structure. Once that is clear then use RSI or MACD to answer a question, about that structure.
That sounds simple.
In practice traders make this much harder than it needs to be. Traders put RSI, MACD moving averages, Bollinger Bands and five other indicators, on one chart and wait for all these indicators to agree.
That isn’t better analysis.
A clean chart pattern near support or resistance can give you insight, than six indicators all pointing the same way.
So where do RSI and MACD actually fit?
What is the real difference between RSI and MACD?
RSI and MACD both analyse price momentum, but they approach it differently.
RSI or Relative Strength Index, is an oscillator that moves between 0 and 100. It helps traders assess how strong a price move is. When the RSI goes above 70 it may signal overbought conditions. When it drops below 30 it may suggest oversold conditions. Traders also look for divergence between the RSI and price to spot trend reversals.
MACD or Moving Average Convergence Divergence works differently. It uses two moving averages. One one slow. To track momentum. The MACD line is created by subtracting the long-term moving average from the short-term moving average. A signal line is then plotted on top of the MACD line. When the MACD line crosses, above the line it may indicate buying pressure. When it crosses below it may signal selling pressure.
The easiest way to remember the distinction is:
RSI asks: “Has price moved too strongly relative to its recent behaviour?”
MACD asks: “Is momentum strengthening or weakening relative to the prevailing trend?”
Those are different questions.
Should you start with RSI, MACD or the price chart?
Start with the price chart.
This is the part many indicator comparisons leave out.
Before opening RSI or MACD, identify:
- the current trend;
- major support and resistance;
- recent swing highs and lows;
- whether price is trending or moving sideways;
- whether a recognisable chart pattern is developing.
Chart patterns are formed from price structure and are commonly classified as reversal, continuation or neutral patterns.TradingView also suggests using ways to check things out instead of just depending on the pattern by itself.
That gives you the background information.
Then choose the indicator.
For example if a stock has been moving between a support zone and resistance zone for several weeks RSI has a more obvious job. It helps spot when the price is getting overbought or oversold in that range. That can be useful for timing entries and exits.
If the stock is making highs and higher lows in a sustained trend MACD becomes more useful, for tracking directional momentum. It shows how strong the trend is and whether it’s speeding up or slowing down. That helps you stay with the trend longer.
When should you use RSI?
RSI should be used when the main question is, about momentum strength, exhaustion or divergence.
A common mistake is treating RSI above 70 as a sell signal and RSI below 30 as a buy signal.
Don’t do that.
An asset in a strong uptrend can remain at elevated RSI readings while price continues higher. The same problem appears during strong downtrends, where RSI can remain weak for an extended period. Current RSI/MACD comparisons also highlight this limitation.
I find that RSI becomes more useful when I combine RSI with market structure.
Imagine a stock repeatedly finds buyers around a support zone.
Price returns to that area again.
This time, RSI also shows weakening selling momentum or a bullish divergence.
Now you have two different pieces of information:
Price: important support is being tested.
RSI: downside momentum is not confirming the latest price weakness.
That is much more meaningful than simply saying “RSI is oversold.”
When is MACD the better tool?
The MACD indicator proves its value when the market is truly moving in a direction.
If a stock is creating a pattern of highs and higher lows the MACD can help you check if the momentum is getting stronger or starting to weaken.
The same idea works for a downtrend.
A MACD crossover or a change in the histogram does not forecast what will happen next. It shows you how recent moving averages and momentum are related at this moment.
If your goal is to join a trend of predicting the exact moment it begins, a little delay doesn’t matter. It’s okay to come in a bit if you’re sure the trend will keep going.
That’s not necessarily a weakness.
If your goal is to participate in a trend rather than catch the exact turning point, some delay is acceptable.
What if the market is moving sideways?
This is where RSI usually becomes more interesting.
Suppose a stock is trading between ₹900 and ₹1,000 for several weeks.
Price approaches ₹900.
Instead of buying simply because RSI falls below 30, look for price behaviour around the support zone.
Does price reject the level?
Does a bullish candlestick pattern appear?
Does momentum start improving?
A bullish engulfing pattern around support, combined with an RSI recovery, gives you a much clearer setup to study than an isolated RSI reading.
The same logic applies near resistance.
The indicator does not create the setup.
Price structure creates the setup. RSI helps you read the momentum inside it.
How does MACD work with chart patterns?
Consider a breakout.
A stock has spent time consolidating below resistance. You identify a bullish chart pattern and price finally breaks above the resistance zone.
A MACD improvement can add useful momentum context.
But don’t make the mistake of saying:
“MACD is bullish, therefore the breakout will work.”
Chart pattern research and educational material always stress the need for confirmation because patterns can fail. TradingView specifically highlights factors, like trend, volume, price confirmation and supporting indicators when validating patterns.
Your process should therefore look more like:
Pattern → key level → breakout → price confirmation → momentum check → risk plan
rather than:
MACD crossover → buy.
That small change makes indicator use much more disciplined.
What about a cup and handle pattern?
The cup and handle pattern is a continuation shape that many traders talk about. It looks like a cup followed by a small pullback that is called the handle. When the price breaks, above the rim or resistance of that cup and handle pattern that break is the signal that the cup and handle pattern is confirmed in chart‑pattern study.
Where does RSI or MACD fit?
After identifying the structure.
If the price is creating a cup. Handle pattern close, to a resistance level you can check if momentum is supporting the breakout that is beginning to happen.
MACD can help you see if momentum is getting stronger as the breakout happens.
RSI can help you understand if the movement is becoming too much.
Neither indicator defines the cup and handle.
The price structure does.
That difference is important to keep in mind because if not, traders begin to notice shapes in the lines of the indicators than looking at the real chart.
RSI vs MACD: which is better for chart patterns?
Neither one is always better.
The better question is:
What is the pattern asking you to look at?
If you have a zone between support and resistance RSI can help you check momentum highs and lows and changes.
If you have a pattern that keeps going inside a trend MACD can help you see if directional momentum supports the movement.
If you have a breakout, price confirmation comes first. Volume and momentum indicators can then provide additional evidence.
TradingViews current chart-pattern guidance also suggests using patterns as one part of an analysis, not as the tool. Relying on patterns can lead to mistakes.
Should you use RSI and MACD together?
Yes,. Give them different jobs.
Putting both on a chart just because they are popular does not improve the analysis.
One practical framework is:
Price action: What is price actually doing?
Chart pattern: What structure is developing?
Support/resistance: Where does the trade idea become invalid?
MACD: Is directional momentum supporting the broader move?
RSI: Is momentum becoming stretched or diverging from price?
That is far cleaner than waiting for RSI and MACD to flash the same signal.
There is another reason not to treat agreement as magical confirmation: both indicators are calculated from price data. Their agreement is not two completely independent pieces of evidence.
What happens when RSI and MACD disagree?
Don’t force a trade.
Suppose price is approaching resistance.
RSI is high, suggesting strong recent momentum, while MACD remains bullish.
A beginner might say, “Both are bullish.”
But the chart says something else:
Price is at resistance.
The correct response is to investigate the level, not ignore it because the indicators look positive.
Now reverse the situation.
Price breaks support, MACD turns bearish, but RSI shows oversold conditions.
That does not automatically mean “buy the dip.”
Oversold describes the recent momentum condition. It does not guarantee that support will hold.
This is where price action trading becomes useful.
The market itself needs to show whether buyers are actually returning.
What are the biggest RSI and MACD mistakes?
Using RSI 70-30 as a reversal system
An overbought reading does not mean price must fall right away. Strong trends can keep RSI high.
Buying every MACD crossover
Sideways markets can create crossovers without a long lasting trend.
Ignoring support and resistance
An indicator reading has different meaning depending on where the price is trading.
Adding more indicators to solve uncertainty
If RSI and MACD disagree, adding another indicator usually provides information to interpret. That does not always translate into a decision.
Trading the pattern before confirmation
A cup and handle, triangle or other formation is not automatically complete simply because the shape resembles the textbook diagram. Chart-pattern resources emphasise confirmation and the possibility of failure.
A simple decision framework for traders
Before using either indicator, ask one question:
What market condition am I looking at?
If price is staying within a range look at support and resistance levels. Use RSI to check for momentum extremes or divergence.
If price is moving clearly in a trend, begin by looking at the trend structure. Use MACD to verify both momentum and the strength of the trend.
If a breakout seems to be happening, wait for price to break and stay above or, below the level. Then check momentum and volume to see if they back the move.
If a chart pattern is still forming and not complete don’t trade based on the name of the pattern. Wait for confirmation.Trade only after the actual condition you defined has occurred.
That last point is easy to overlook.
A trader who learns ten chart patterns but cannot define where the setup fails is not necessarily better prepared than someone who knows three patterns properly.
How Trendy Traders Academy approaches indicators
At Trendy Traders Academy, the goal is not to turn traders into indicator collectors.
The academy was founded in 2018 and has 45,000+ traders and learners, with a 3,000+ strong trading community.
The useful skill is learning how indicators fit into a broader trading process: price action, technical analysis, risk management, execution and trade review.
If you’re learning chart patterns, don’t start by memorising twenty formations.
Begin with support and resistance then explore trend structure and next study price action.
When you want a momentum‑extreme or divergence perspective add RSI to your analysis.
When you need a trend‑momentum context use MACD.
And before taking a trade, ask a less exciting but far more useful question:
“Where is my trade idea wrong?”
That question will save you from more bad trades than another indicator on your screen.
FAQs
What is the main difference between RSI and MACD?
RSI is a 0–100 momentum oscillator commonly used to study momentum extremes and divergence, while MACD uses moving averages to analyse changes in momentum and trend direction.
Is RSI better than MACD?
Neither indicator is universally better. RSI is useful for studying momentum extremes and divergence, while MACD is useful for analysing trend momentum and momentum changes. The choice depends on the market structure and trading question.
When should traders use RSI?
RSI is useful when a trader wants to examine recent momentum, overbought or oversold conditions, or divergence, particularly when price is moving within a defined range.
When should traders use MACD?
MACD is useful when a trader wants to examine trend direction and changes in directional momentum, particularly in markets showing a clearer trend.
Can RSI and MACD be used together?
Yes. They can be used together when each has a separate role, such as using MACD for broader trend-momentum context and RSI for momentum extremes or divergence. Price action and support/resistance should still provide the primary market context.